

Table of contents
Hide
Introduction to and Installation of Adobe Illustrator

A Powerful Tool for Scientific Illustration: A Comprehensive Guide to Adobe Illustrator
In scientific research papers, a clear illustration is often more persuasive than long blocks of text. Adobe Illustrator (commonly known as AI) is the tool of choice for many researchers when creating high-quality vector graphics. Whether you need to draw schematic diagrams of mechanisms, enhance data visualizations, or create figure summaries and academic posters, Illustrator can help you get the job done more efficiently.
What is Adobe Illustrator?
Adobe Illustrator is a professionalVector graphics editing software, developed by Adobe. Unlike Photoshop, which works with raster images, Illustrator uses paths, shapes, and text defined by mathematical formulas to construct graphics, so it canInfinite magnification without distortion. This feature is particularly important for scientific images that must meet the high-resolution requirements of journals.
Simply put:
- Bitmap images (such as Photoshop images): When zoomed in, the image appears jagged and blurry.
- Vector graphics (such as Illustrator files): Edges remain sharp and lines remain smooth regardless of the zoom level.

Key Uses of Illustrator in Scientific Research
In scientific research, Illustrator has a wide range of applications:
- Illustrations and Diagrams in the Paper: Illustrate cell structures, signaling pathways, experimental setups, molecular mechanisms, etc.
- Data Visualization: Apply a consistent style to figures exported from Excel, Python, R, and other sources to ensure that fonts, colors, and line thicknesses comply with journal requirements.
- Graphical Abstract: Many journals require the submission of an image that summarizes the core findings of the full text, and Illustrator is the ideal tool for creating such summaries.
- Academic Posters: Use the artboard and multi-layer features to design a meeting poster with a clear layout and an appealing visual design.
- Multi-Panel Puzzle: Precisely align multiple experimental images and charts, label them with letters (A, B, C…), and export them as a single large image.


Key Features and Benefits
1. Vector Drawing Tools
Illustrator offers powerful drawing tools, such as:
- Pen Tool: Drawing arbitrary curves and custom shapes is the most essential tool in scientific graphics.
- Curvature Tool: More intuitive than a pen tool, it’s ideal for beginners to quickly create smooth curves.
- Shape Generator: Quickly create complex shapes by combining and subtracting multiple basic shapes.
2. Precise Typesetting and Alignment
In scientific illustrations, precise alignment of elements is crucial. Illustrator’s Align panel, Smart Guides, and Grid System ensure that all elements are positioned accurately and spaced consistently.
3. Powerful Layer Management
Similar to Photoshop, Illustrator supports multi-layer management. You can place different elements—such as the cell nucleus, cytoplasm, and label text—on separate layers, making it easy to edit and hide them individually, which greatly improves editing efficiency.
4. Supports multiple scientific graphing formats
Illustrator supports a wide range of popular file formats, including EPS, FXG, PSD, TIFF, GIF, JPEG, SWF, SVG, DWG, and DXF, making it easy for users to exchange and share files between different software programs. This means you can:
- Import PDF or SVG charts generated by Python (Matplotlib) or R (ggplot2) directly into Illustrator to further customize lines, fonts, and colors.
- Export the edited figure in the format required by the journal TIFF, PDF, EPS formats such as these, with resolutions ranging from 300 to 1,200 dpi.
5. Batch Editing and Style Consistency
Using the “Select Similar” feature, you can select all objects with the same color, line weight, or font type with a single click and then modify them all at once. This is particularly efficient when working with complex charts exported from data software.
Downloading and Installing Adobe Illustrator
Install Adobe Illustrator: Powerful Vector Graphics Software

Download Method 1
This post features Adobe Illustrator 2026 (v30.3.0.182),
This resource is shared for personal study only; please do not use it for any commercial purposes. Thank you!
This blog will continue to share more useful research resources, so please stay tuned!
The materials are packaged and stored in the cloud drive.Adobe Illustrator 2026 (v30.3.0.182) Cloud storage download link:
You need to log in to view the full content
Already logged in?Refresh immediately
Download Method 2
Follow the XC Research WeChat official account to get it.

Installation method
After downloading the compressed file, extract it to a folder.
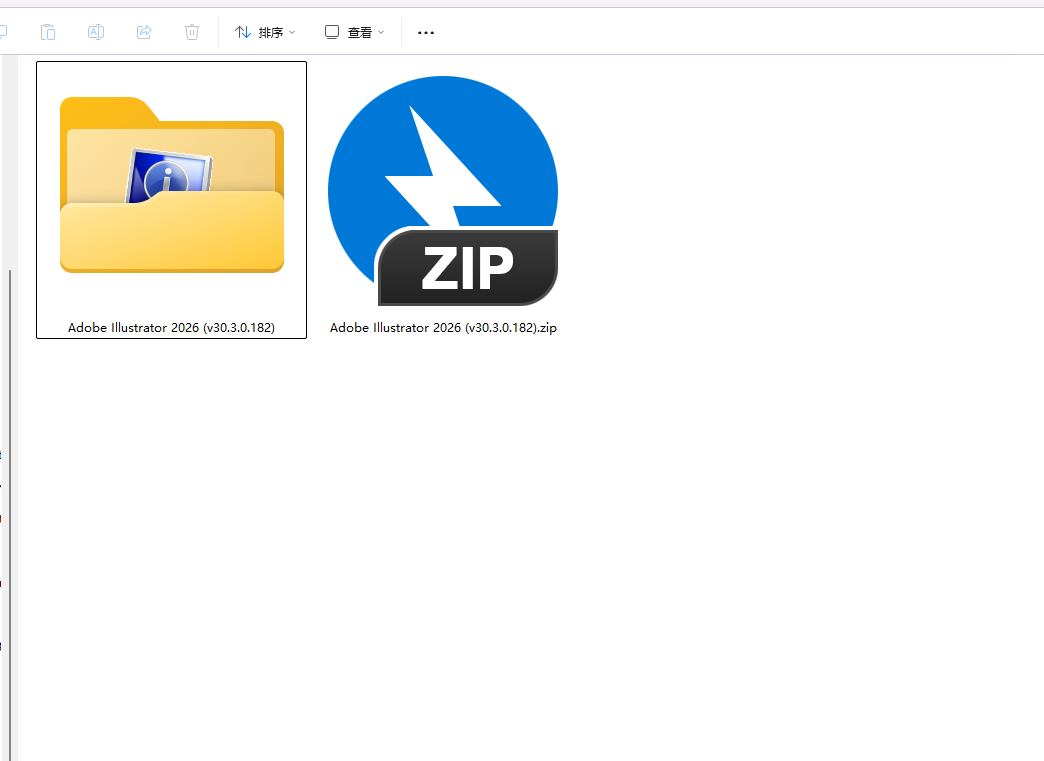
OpenAdobe 2026Folder.
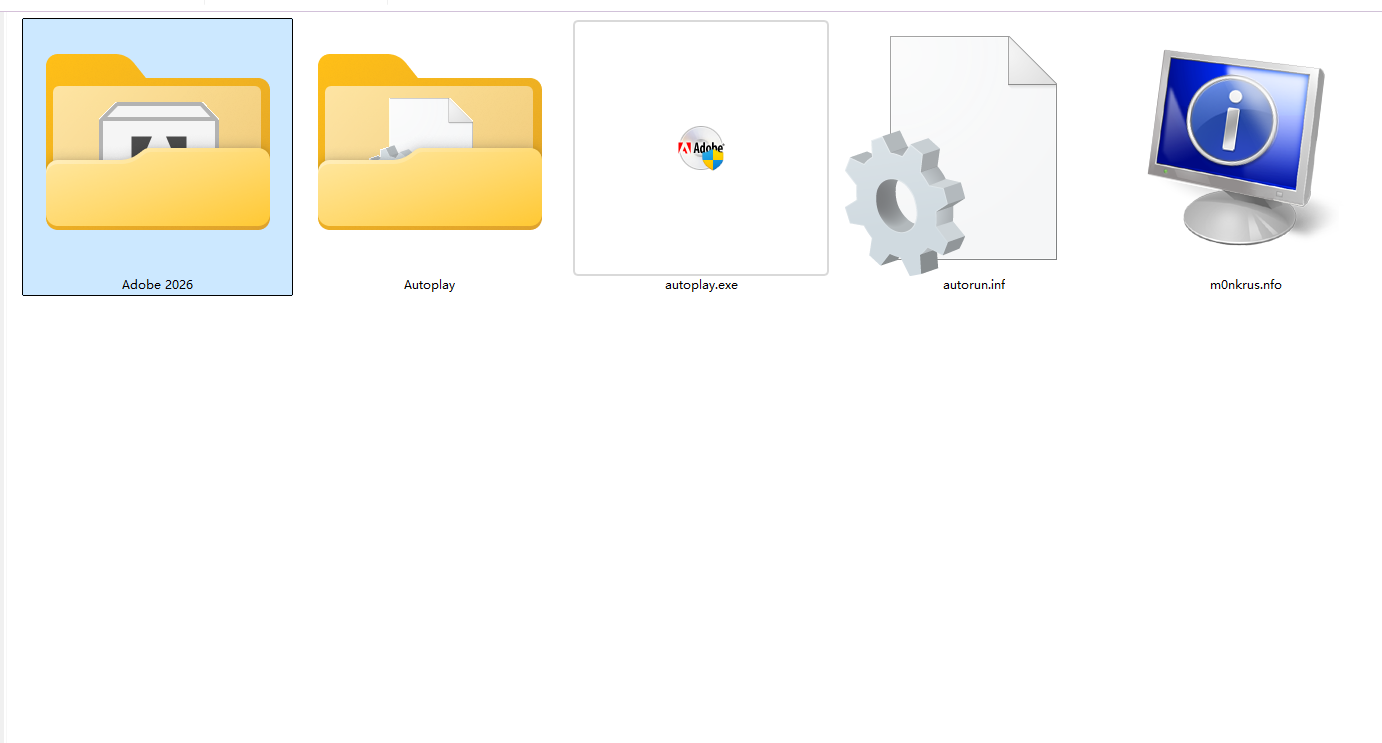
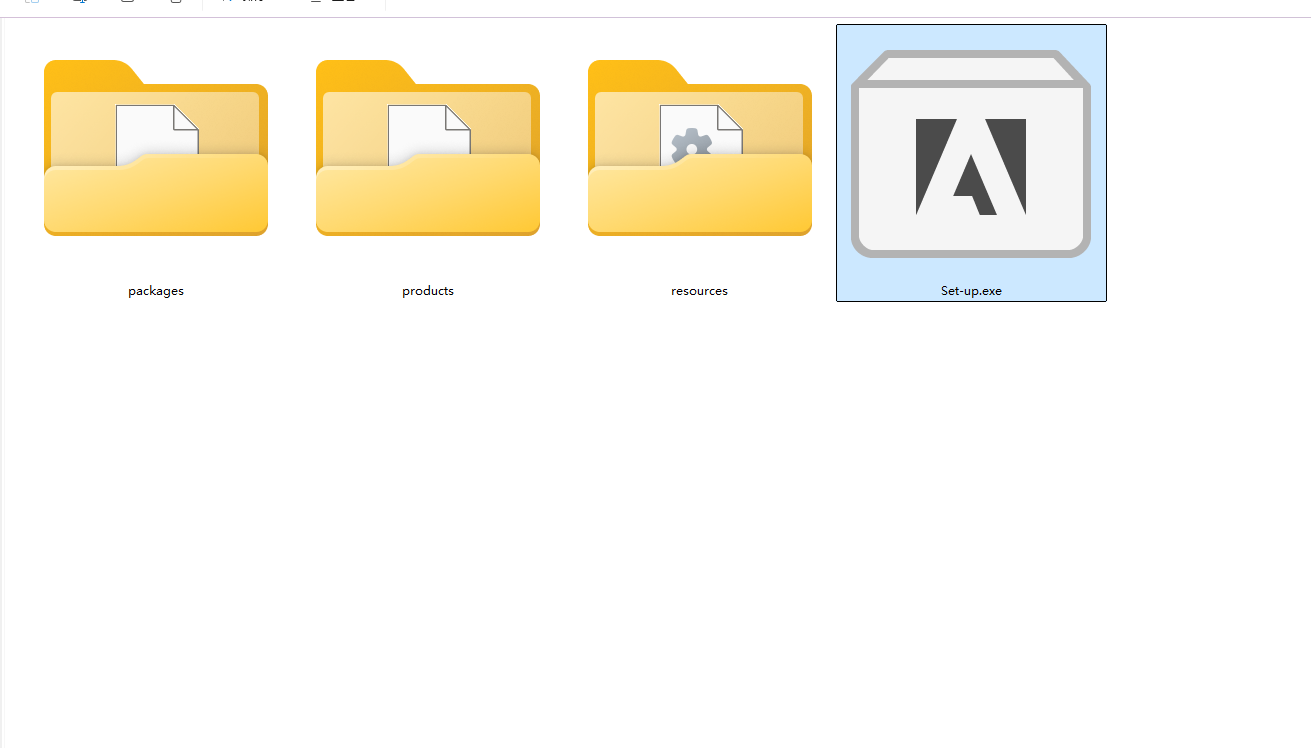
Double-clickSet-up.exe, Start the installation.
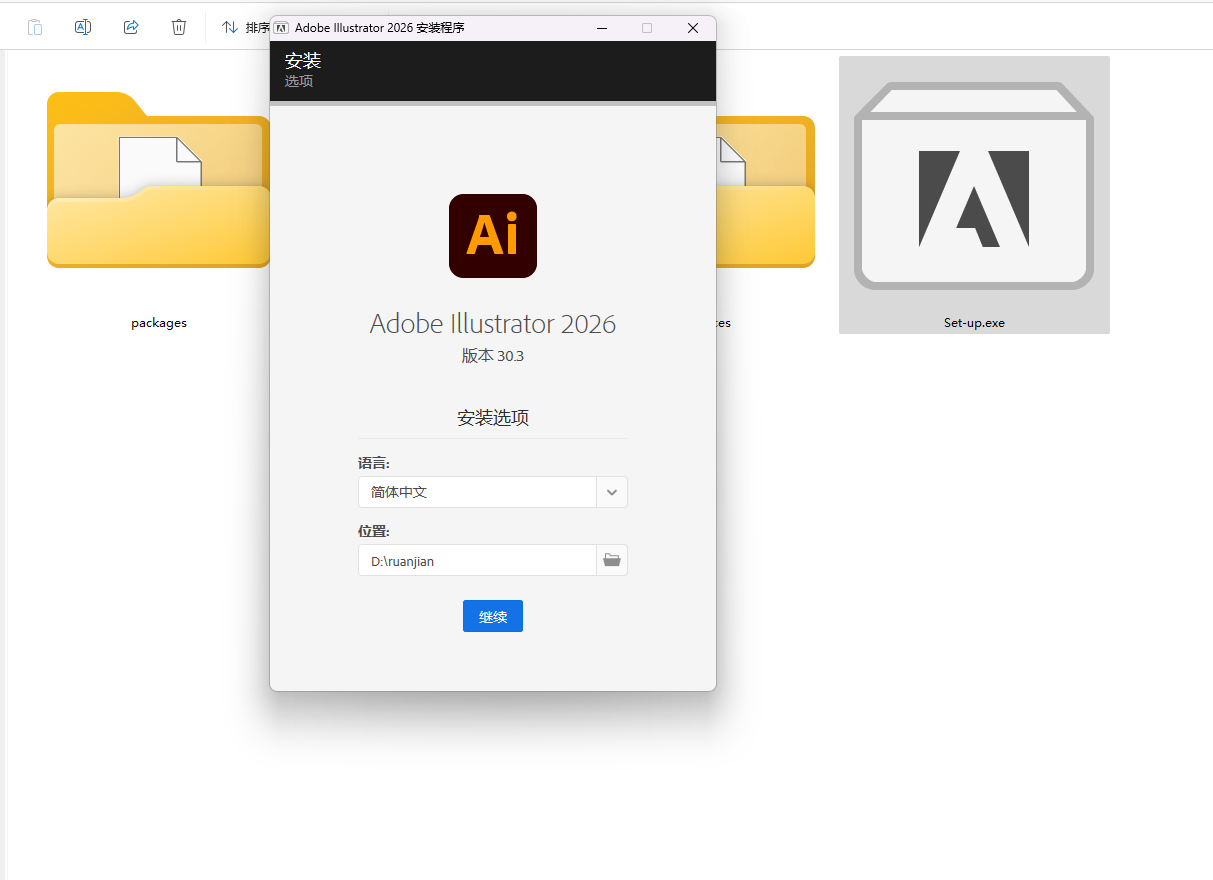
Select an appropriate installation location—we recommend installing it on a drive other than Drive C—then clickContinueStart the installation.
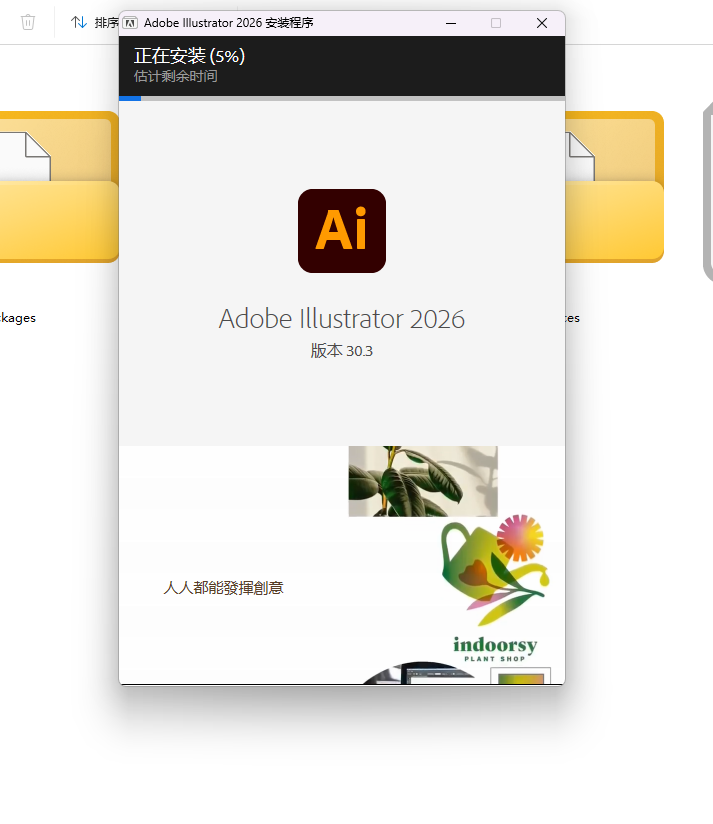
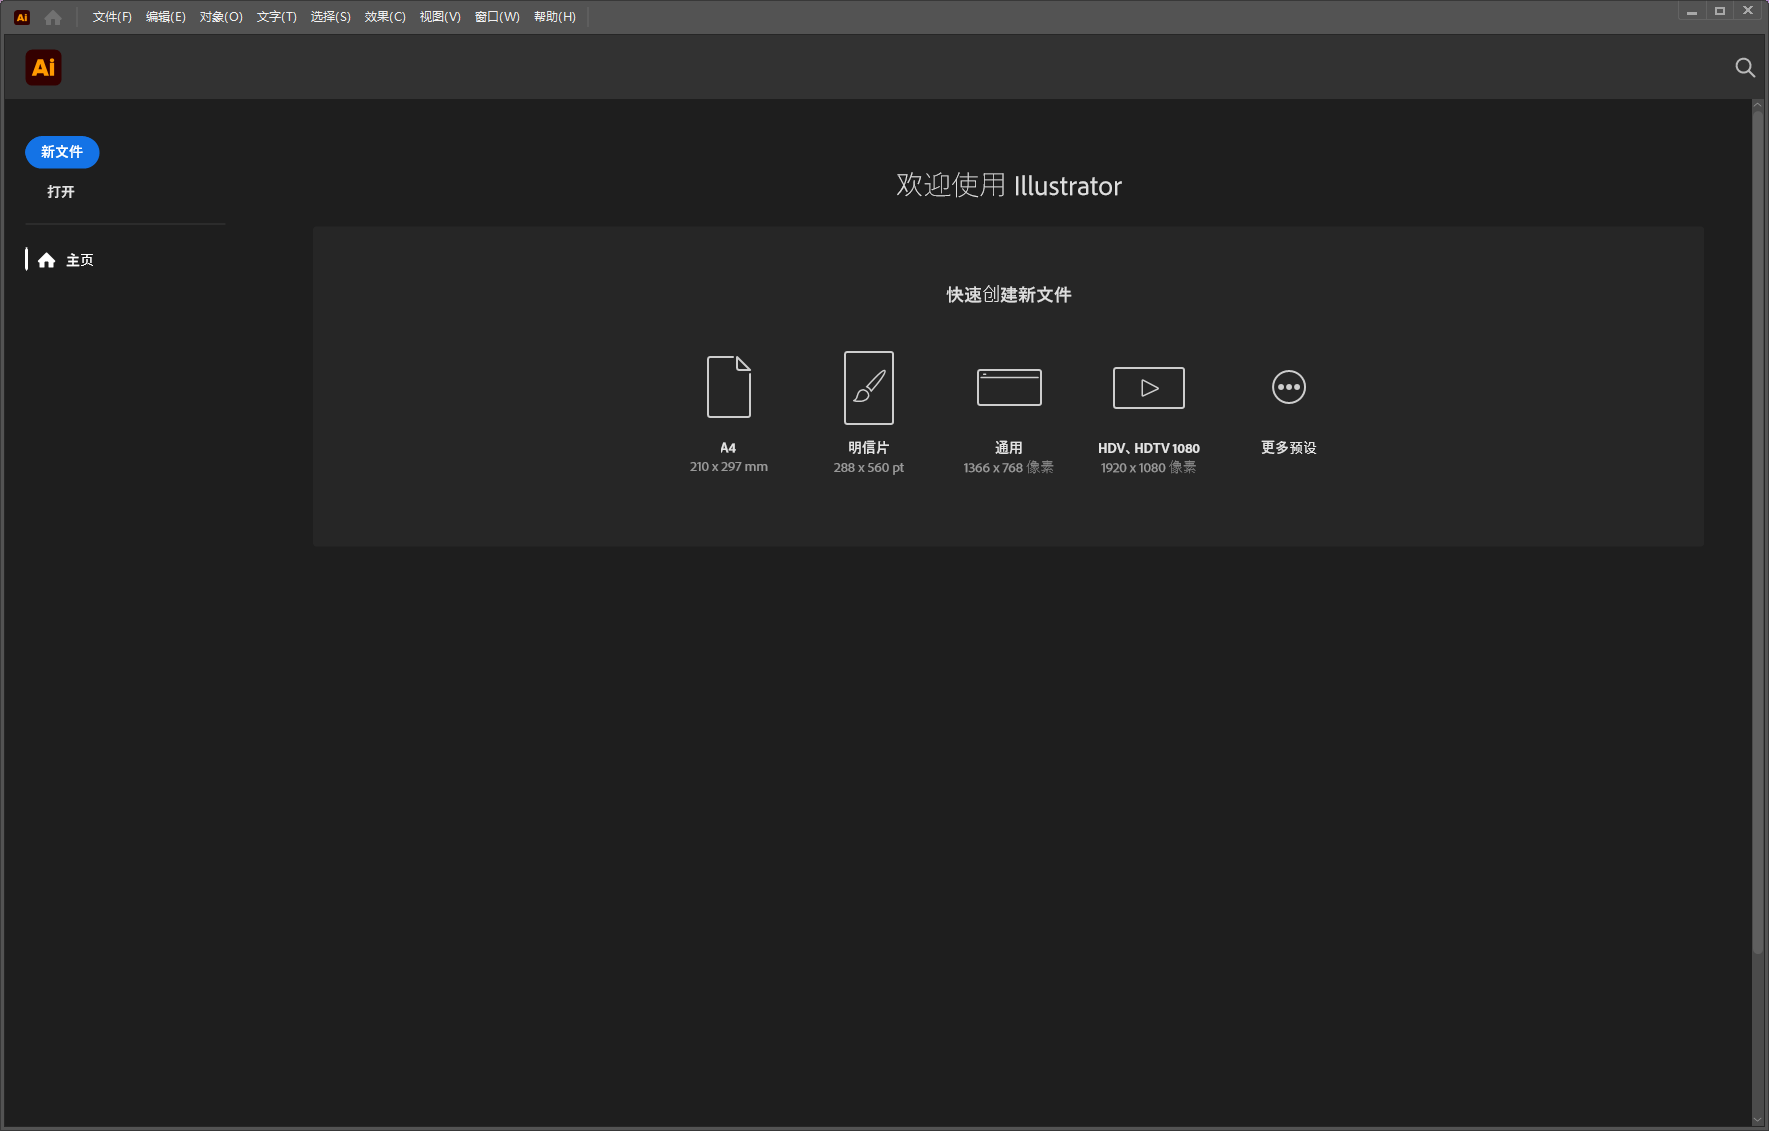
Wait for the installation to finish; no further action is required. The installation is complete.

Typical Workflow: From Data to Figure in a Paper
Here is a typical workflow for a researcher using Illustrator:
- Generate Basic Charts: Create data visualizations in Python, R, Excel, or GraphPad, and export them in PDF or SVG format.
- Import into Illustrator: Open the exported vector file, ungroup it, and remove the clipping mask so that each element can be edited individually.
- Standardize the Format: Adjust the font and size of all text (e.g., Arial, Helvetica), and standardize line weight and color.
- Add a label: Use the arrow, leader, and text tools to add callouts (such as
*、**), scale, or legend. - Combine Multiple Images: Create an artboard that fits the journal’s single-column or two-column width, arrange multiple figures precisely, and add figure captions with numbering.
- Export the final file: Save the AI source file for future editing, and export a high-resolution TIFF (≥300 dpi) or PDF for submission.
Comparison with Other Tools
| Tools | Type | Advantages | Disadvantages |
|---|---|---|---|
| Adobe Illustrator | Vector Editing | Comprehensive, flexible, and professional | Requires a paid subscription; the learning curve is fairly steep |
| Inkscape | Vector Editor (Free) | Free and open-source, with features comparable to AI | The interface isn't polished enough, and some features are a bit lacking. |
| PowerPoint | Demo Software | Easy to get started with; ideal for simple diagrams | Low layout accuracy and limited export resolution |
| BioRender | Online Scientific Plotting | Wide variety of templates; easy to use | Limited customization; requires a paid subscription |
| Photoshop | Bitmap Editing | Suitable for processing photographic images | Not suitable for creating vector diagrams |
Study Tips and Practical Strategies
- Start with the official tutorial: The Adobe website offers comprehensive introductory tutorials suitable for users with no prior experience.
- Practice tracing existing shapes: Find a diagram from a research paper and try to redraw it in Illustrator—this is the fastest way to improve your skills.
- Master Common Keyboard Shortcuts: For example
V(Select Tool),P(Pen Tool),A(Direct Selection Tool),Ctrl/Cmd + G(Formation),Ctrl/Cmd + Shift + G(Cancel the formation). - Create a Personal Template Library: Save commonly used arrows, organelles, molecular structures, and other elements as symbols or separate files so they can be easily reused later, significantly improving efficiency.
- Make Good Use of Layer Names: Name each layer, such as “Cell Membrane,” “Cell Nucleus,” and “Labels,” to avoid confusion later on.
Frequently Asked Questions
Q: Is Illustrator hard to learn?
A: For scientific illustration needs, you don’t need to master every feature. Focus on learning the Pen tool, Selection tools, alignment, and export functions, and you’ll be up and running in about one to two weeks.
Q: Are there any free alternatives?
A: Yes, Inkscape is the closest free alternative and supports most vector editing features. However, if your institution offers Adobe Education Edition, using Illustrator will provide a better experience and access to more learning resources.
Q: Compared to BioRender, which one should I choose?
A: BioRender is suitable for quickly creating standardized biological diagrams, but it offers limited customization. Illustrator, on the other hand, provides complete creative freedom and is suitable for complex graphics that require unique designs.
Conclusion
Adobe Illustrator is an indispensable tool in the field of scientific visualization. Not only does it help you create high-quality figures that meet journal standards, but it also enhances the overall professionalism and readability of your papers. Although it requires some initial time and effort to learn, once you’ve mastered it, it will serve you throughout your entire research career as a powerful tool for expressing your scientific ideas.
If you want to take the illustrations in your thesis from “adequate” to “outstanding,” start experimenting with Adobe Illustrator today.